The world is on edge at the prospect of a resurgent wave of infections. Models and speculation are rife, but facts remain scarce, which is why the events in Wisconsin on April 7, and their eventual impact, are so important.
As COVID-19 advanced across the globe, most countries reacted by instituting shelter-in-place and lock-down strategies. As those curbs now begin to ease, the world is on edge at the prospect of a resurgent wave of infections. Models and speculation are rife, but facts remain scarce.
Which is why the events in Wisconsin on April 7, and their eventual impact, are so important.
On that day, citizens who wished to exercise their right to vote in the state’s political primary were forced to go in person to the polls. Strong opposition and a series of court rulings had foreclosed earlier hopes for conducting the primary entirely by mail. In hindsight, the events in Wisconsin clearly demonstrate the outcome of a deliberate one-day easing of social distancing practices—and this grim picture may be worth more than a thousand words of speculation and modeling.
A straightforward statistical and graphical analysis of Wisconsin’s COVID-19 daily confirmed new cases and death counts show a clear surge in both, with lags characteristic of the independently measured course of the Coronavirus. The deadly cycle typically takes between twenty-two and twenty-six days from the first signs of infection, to hospitalization, through the intensive care unit, and too often, to death.
As Figure 1, based on data from the Wisconsin Department of Health[1], reveals, a cascade of new cases in the period following the April 7 in-person election is apparent. The grey circle markers show the daily count of new confirmed COVID-19 infections in Wisconsin by date. The blue line is a smoothed average of the new case count that highlights trends over time.
Figure 1
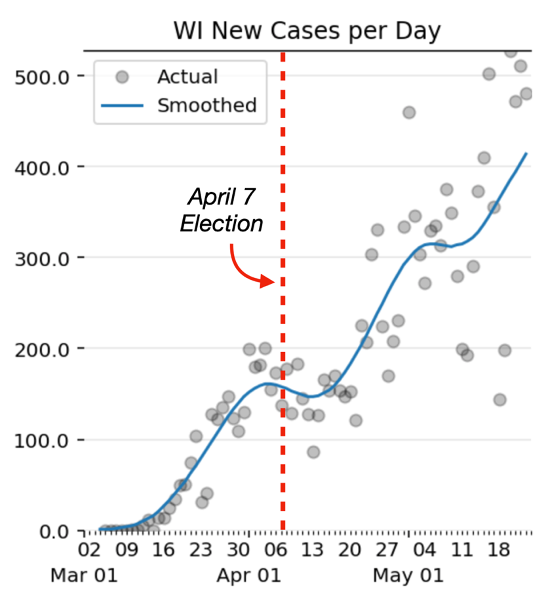
Source: Wisconsin State Department of Health data.
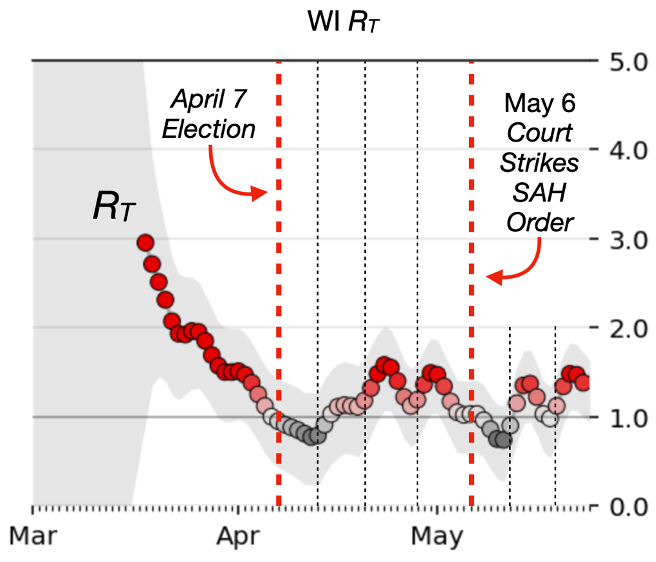
Figure 2 offers more detail on this surge. It shows daily estimates of the COVID-19 “effective” reproductive number (Rt ), which is the virus’s transmission rate, on any given date.[2] Put simply, Rt is the number of people a single COVID-19-positive patient would likely infect on that date. If Rt is greater than one (represented in red), the virus is spreading exponentially. If Rt is less than one (represented in grey), it is being suppressed. This measure reflects the effectiveness (or lack thereof) of any social distancing, sheltering, or other abatement measures on the growth or suppression of the virus.
Figure 2
Source: See text
Figure 2 above shows a measurable resurgence of the virus within six days of the in-person April 7, 2020 primary election vote. This surge is tightly synchronized with the expected up-tick from the independently measured and published incubation period of COVID-19 (marked by the vertical black dashed lines). The pattern is repeated within fourteen days and again at 22 days after the election, consistent with the people first infected on the 7th going on to infect subsequent sets of people, with additional new generations of infected each 5-7 days. Only after the third surge of infections, three weeks after the election, do the distancing and sheltering orders finally resume dampening the resurgence of the virus. A similar pattern can be seen following the Wisconsin Supreme Court’s action to strike down the Wisconsin governor’s stay-at-home orders on May 6, with cases now, once again, resurgent.
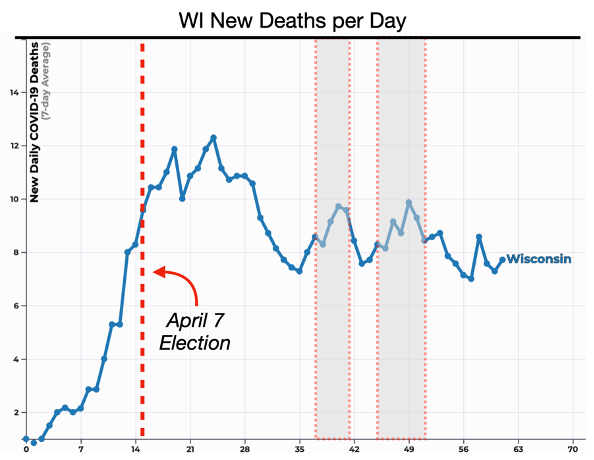
Figure 3 below depicts the daily count of new confirmed COVID-19 deaths in Wisconsin by date[3], smoothed to display a 7-day moving average to highlight trends. Here again, surges in the number of deaths occur at intervals consistent with usual course of COVID-19 treatment and mortality. The COVID-19 median time interval from infection to symptoms (or serial interval) is 5-7 days[4] and then from symptom development to death is 16.9–19.2 days.[5],[6] Using this data independently sampled from Wuhan, Lombardy, and NY, patient deaths from those infected on April 7 would be expected to peak exactly within the grey-shaded time intervals.
Figure 3
References and Notes
[1] Daily New Case data is from the Wisconsin Department of Health Services, https://www.dhs.wisconsin.gov/outbreaks/index.htm; accessed May 23, 2020.
[2] The real-time Rt estimates were calculated through Bayesian statistical analysis of the data in Figure 1: WI New Cases per Day. Uncertainty in the measure is reflected by the grey-shaded area that spans the 90% confidence interval of the Rtestimate. (In other words, there is a 90% chance that the actual Rt is within the grey-shaded area, with the most likely value at the red/grey markers).
[3] Daily death count data was sourced from Johns Hopkins CSSE, https://systems.jhu.edu/research/public-health/ncov/, and updated May 22, 2020.
[4] Du Z, Xu X, Wu Y, Wang L, Cowling BJ, Meyers L. Serial Interval of COVID-19 among Publicly Reported Confirmed Cases. Emerg Infect Dis. 2020;26(6):1341-1343. https://dx.doi.org/10.3201/eid2606.200357
[5] Yang X, Yu Y, Xu J, Shu H, Xia J, Liu H, et al. Clinical course and outcomes of critically ill patients with SARS-CoV-2 pneumonia in Wuhan, China: a single-centered, retrospective, observational study. Lancet Respir Med. 2020;S2213-2600(20)30079-5 https://www.thelancet.com/journals/lanres/article/PIIS2213-2600(20)30079-5/fulltext
[6] Verity R, Okell L, Dorigatti I, Winskill P, Whittaker C, Imai N, et al. Estimates of the severity of coronavirus disease 2019: a model-based analysis. The Lancet March 30, 2020. https://doi.org/10.1016/S1473-3099(20)30243-7