Lance Taylor responds to Andrew Smithers’s comment on his INET working paper, “Germany and China Have Savings Gluts, the USA Is a Sump: So What?”
In response to Andrew Smithers, the main point in my “Savings glut….” paper (Taylor, 2020) is that East Asian countries and the United States restructured their economies to support continuing trade imbalances for four decades and counting. Ben Bernanke’s (2015) “savings glut” is a strange description of international trade. An economy with a trade surplus (exports exceed imports) generates an “export glut” of physical goods and services. Saving is an act of finance. A net importer has to issue new liabilities (think of US Treasury bonds) to pay for its purchases of stuff from abroad. It is better described as a “net borrower” with the exporter being a “net lender” because it is accepting those liabilities.
Meanwhile after 1970 the gross corporate profit share in US domestic income rose steadily by eight percentage points. Contrary to Smithers’s claim, there has been no reversion to mean. The lion’s share of the proceeds after taxes flowed via interest, dividends, capital gains, and share buybacks to the top one percent of households in the size distribution of income (Taylor with Ömer, 2020). These observations address Smithers’s comments.
He accepts the concept of American net borrowing, but misconstrues it as being the result of a corporate “investment dearth.” If the overall economy is a net borrower then actors within it such as the corporate business sector must be borrowing when their investment exceeds their saving. If its investment declines (in fact the case for the USA) then business will become a net lender and some other sector(s) must do the borrowing. That turns out to be the government. Comparing an Asian savings glut with an American investment dearth confuses apples with oranges. Smithers’s “net private sector savings surplus shown in the developed world….” describes American households (mostly rich ones) but not business.
He goes on to say that “In fact the US profit share is stationary and was in 2019, before the pandemic, slightly below its mean reverting average for US non-financial corporate business and slightly above if financial business is included….” Apparently the rest of us have seen a rising profit share because of underestimated depreciation of business capital. As shown below, US national accounts do not admit to this error. Their double entry bookkeeping shows that households (especially the well-to-do) benefitted handily from rising distributed profits. In the macroeconomic savings = investment identity, a number labeled depreciation can be subtracted from both sides without changing the basic accounting. Financial transfers would continue to be paid while with high depreciation arithmetic business would get a paper loss in wealth.
In more detail, Figure 1 in the paper (reproduced here) shows annual net borrowing (positive) and net lending (negative) shares of GDP for four institutional sectors — households, corporate business, government, and the rest of the world. The shares sum to zero in the national accounts. Four points stand out.
Figure 1
Prior to the early 1980s the rest of the world had small positions, either lending or borrowing. Thereafter it was a consistent net lender to the USA, with flows in some years ranging toward five percent of GDP.
In almost all years, households were net lenders.
Government was a consistent net borrower.
Business, notably, switched in the 1990s from usually being a net borrower to a lender (2008 when profits collapsed is the major exception).
As illustrated below, Smithers is correct in saying that there was a business “investment dearth.” That is why the sector switched toward net lending.[1] It did not play a role in generating American net borrowing. That became the task of government.
Smithers focuses on net investment or gross fixed capital formation minus depreciation, called a capital consumption allowance (CCA) in the jargon of the US Bureau of Economic Analysis (BEA) which constructs the national accounts. In principle the BEA accounts are based on market transactions, but there are no bills of sale labeled “CCA”. The amount is estimated, from tax data for non-farm corporate and proprietors’ business. Presumably the numbers are realistic, but certainly subject to the vagaries of Internal Revenue Service guidelines.
Regardless of potential errors in calculating CCA, business firms have to meet contractual payments obligations, notably financial transfers (interest and dividends) and direct taxes. Subtracting estimated CCA and these observable flows from corporate operating surplus gives net profits of business, shown in ratio form in Figure 2. Pretty clearly the net profit rate relative to business capital has gone up across business cycles (recession periods according to the National Bureau of Economic Research are shaded). The same is true of the profits to GDP ratio. There is no apparent reversion to mean.[2]
Figure 2
Smithers is certainly correct in observing that there is a business investment dearth, as shown in Figure 3. Beginning in the 1980s all the ratios trend downward as part and parcel of the general structural realignment of the American economy that got underway 40 or 50 years ago. Raising the estimate of CCA would shift all the curves in Figures 2 and 3 downward without changing their comparisons.
Figure 3
References
Bernanke, Ben (2015) “Why Are Interest Rates So Low, Part 3: The Global Savings Glut,” https://www.brookings.edu/blog/ben-bernanke/2015/04/01/why-are-interest-rates-so-low-part-3-the-global-savings-glut/
Taylor, Lance (2020) “Germany and China Have Savings Gluts, the USA is a Sump: So What?” Institute for New Economic Thinking Working Paper No. 132; https://doi.org/10.36687/inetw…
Taylor, Lance, with Özlem Ömer (2020) Macroeconomic Inequality from Reagan to Trump: Market Power, Wage Repression, Asset Price Inflation, and Industrial Decline, New York: Cambridge University Press.
[1] Smithers correctly describes this shift in his last paragraph, without noting that it forces government to become the borrower of last resort.
[2] Smithers refers to shares of corporate output. For the USA at least, Bureau of Labor Statistics data show a declining wage share in business output. The profit share in national income at factor cost varies in the range of 21% to 25%, mostly rising since the 1970s.
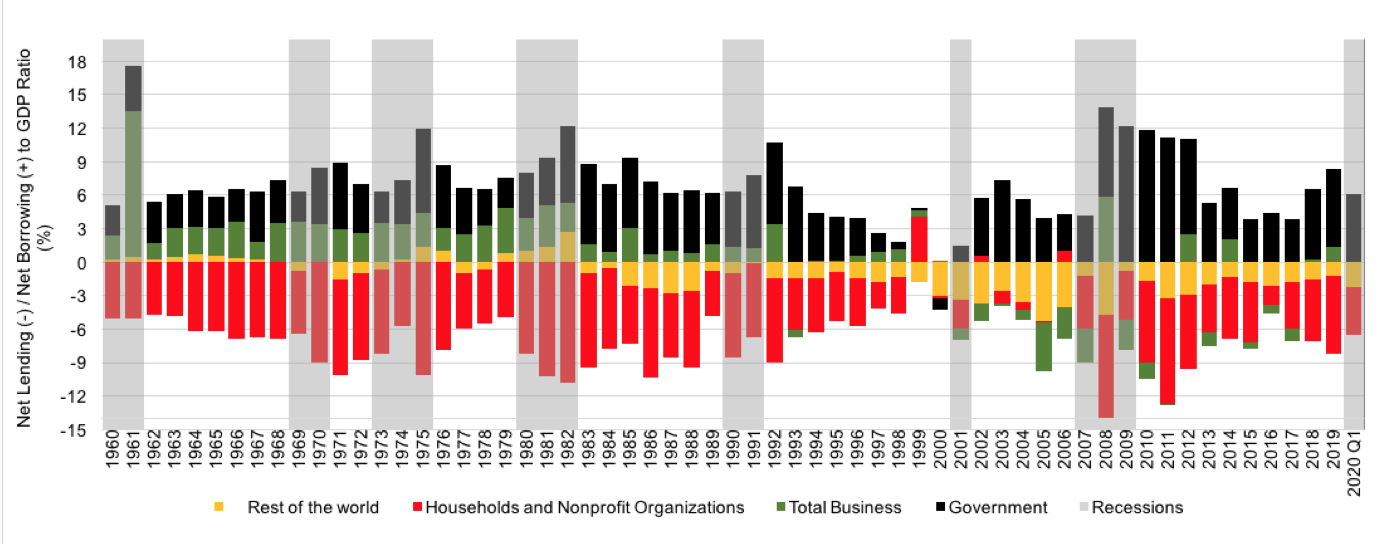
Figure 1: US annual net borrowing (positive) and net lending (negative) shares of GDP
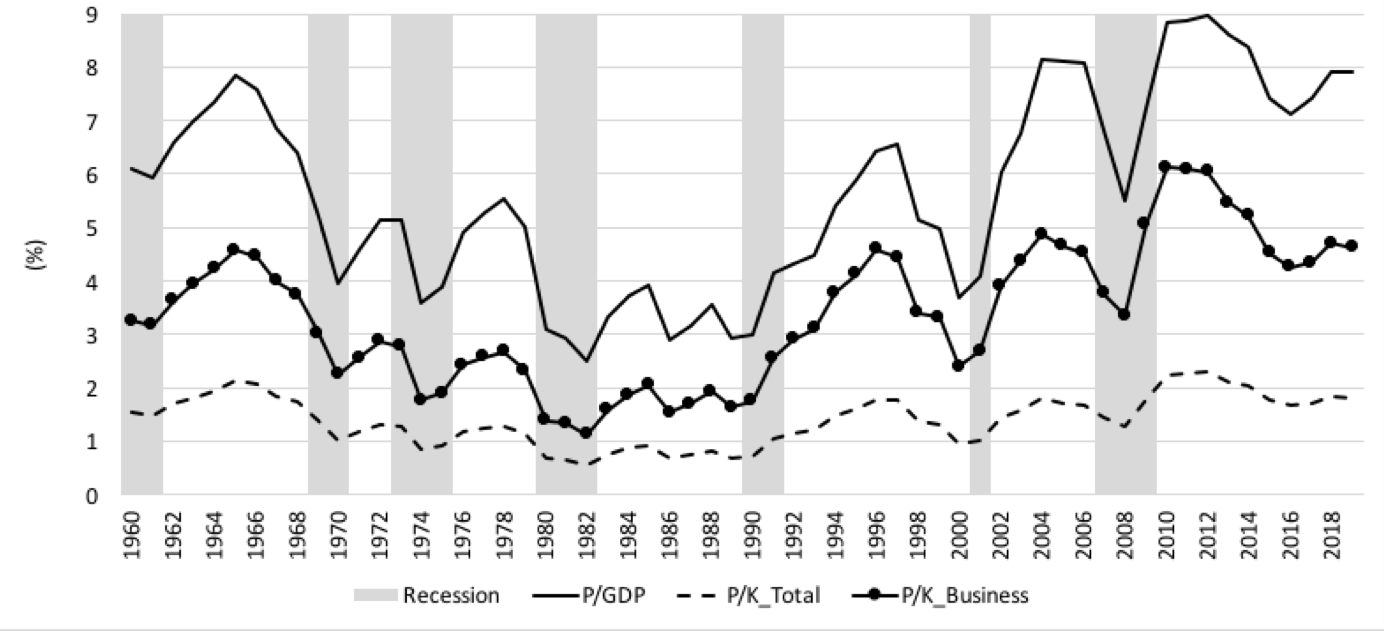
Figure 2: Ratios of P = (business profits – CCA - direct taxes - financial transfers) to GDP and capital stocks
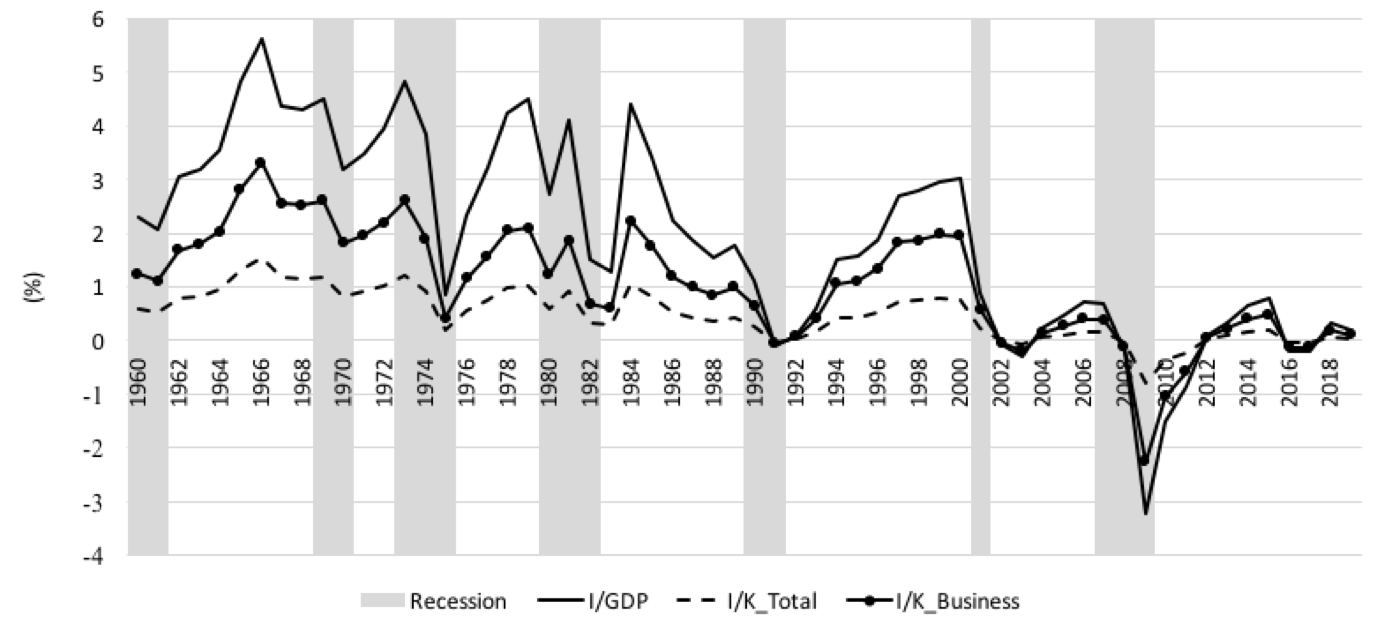
Figure 3: Ratios of I = (business gross fixed capital formation – CCA) to GDP and capital stocks


