A look at the American household debt boom
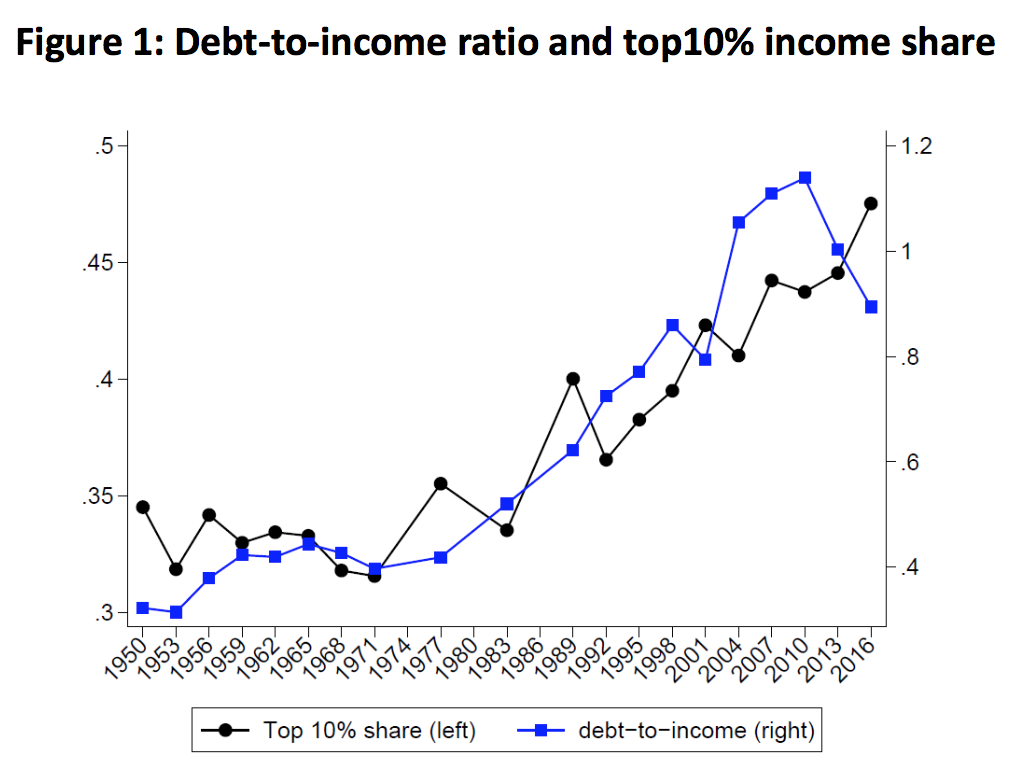
American household debt has skyrocketed in the past seven decades. The household debt-to-income ratio stood at 30% at the end of World War II. It peaked at close to 120% in the wake of the last financial crisis (Jordà et al. 2017). How do we make sense of this long-run increase in household debt over so many decades?
Rising income inequality is frequently invoked as a key factor. Over the past half century, the share of the richest 10% of households in total household income increased from below 35% to almost 50% (Piketty and Saez 2003; Kuhn et al 2020), as shown in figure 1. Rajan’s (2011) book “Fault Lines” made the case that for large parts of the population debt growth substituted for income growth. Are growing income inequality and indebtedness two sides of the same coin? Did households with stagnant incomes increasingly rely on debt to finance consumption, sustained by lending from the top-1%, as argued in recent paper by Mian, Straub and Sufi (2020)?
We still know surprisingly little about the growth of household debt in America over the past half century. From the perspective of the borrowers, the financial history of the increase of U.S. household debt and its changing distribution remains largely unwritten. Our new paper closes this gap. We study the evolution of household debt over the entire postwar period, asking which households borrowed so much more, and why.
Without long-run household-level data for the joint distributions of income, debt, and assets, this task would be impossible. However, we can rely on a new dataset that combines historical waves of the Survey of Consumer Finances (SCF), going back to 1949, with the modern SCF that the Federal Reserve Board has administered since 1983 (for details see Kuhn et al., 2020) This long-run “SCF+” makes it possible to follow the evolution of household borrowing across the entire income distribution over seven decades.
Low income-growth households with high debt growth
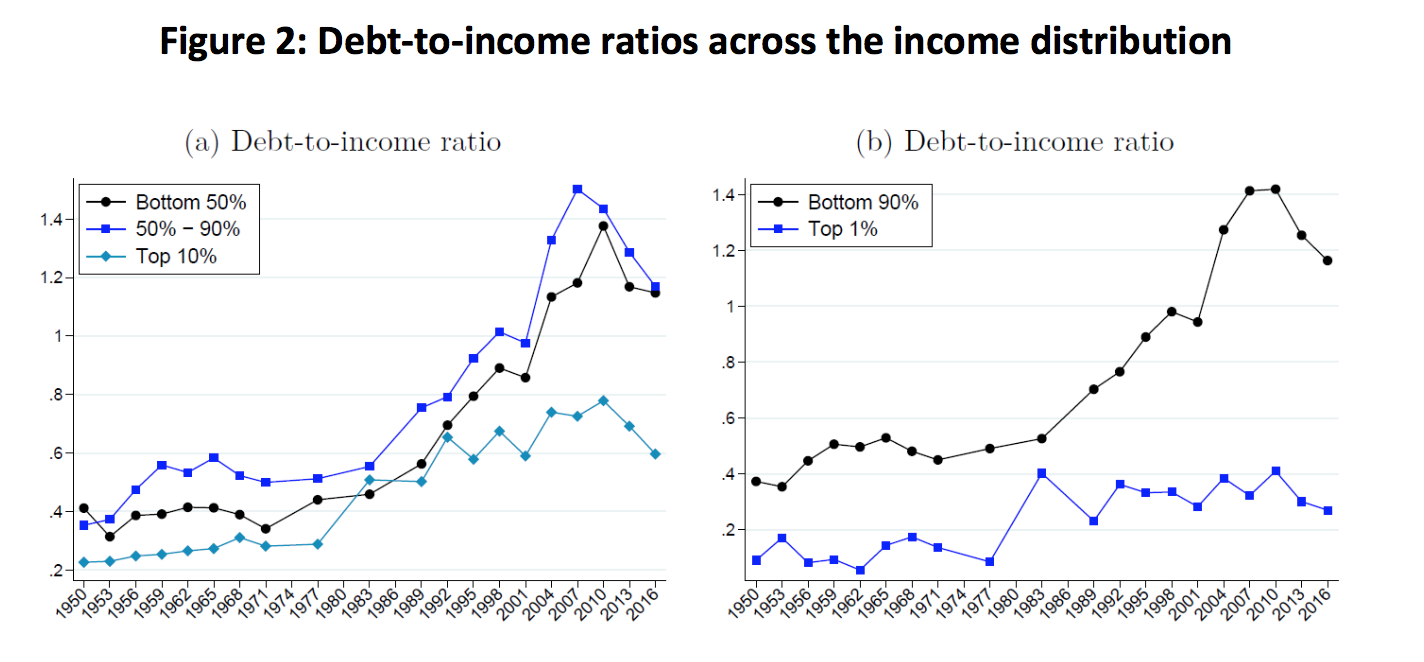
The data confirm that debt growth was indeed concentrated among households with low income growth. Debt-to-income ratios have risen most dramatically for households whose share in aggregate income has stagnated or fallen. This is particularly true for middle-class households, defined as households between the 50th and 90th percentiles of the income distribution. They account for about 55% of the total increase in household debt since 1950. Households in the bottom 50% of the income distribution account for a relatively small share of the total debt increase with only 15%. Their share in total debt has actually fallen over time.
The American household debt boom of the past decades was first and foremost a middle-class affair. Middle class incomes grew by 20% since 1970, middle-class debt by 250%. Figure 2 displays the sharp divergence in debt-to-income ratios across the distribution. This association between low income growth and high borrowing is puzzling. In standard economic logic, households are typically expected to borrow against the expectation of higher, not lower or stagnant, future income.
What was going on? In a nutshell, middle-class American families fell behind with regard to income and borrowed against their houses to finance spending. As house prices went up the main financial asset of middle-class households appreciated in value. In inflation-adjusted terms, quality-adjusted house prices in the United States increased by 75% between the mid-1970s and the mid-2000s. Housing wealth-to-income ratios of middle-class households more than doubled from 140% of income to 300% in 2007. This allowed households to borrow against higher housing wealth and grow spending in excess of income. We show that this “housing as an ATM mechanism” explains 50% of the household debt increase in the US since the 1970s. Two developments came together to sustain this mechanism over multiple decades. First, financial liberalization in the 1980s led to the development of new financial products that allowed households to tap into housing equity such as home equity loans. The 1986 tax reform was particularly important. It abolished interest deductibility for personal loans, but maintained it for mortgages, and thereby created incentives to switch to home-equity-based products. Banks heavily advertised these new products in the 1980s with catchphrases such as “Now, when the value of your home goes up, you can take credit for it.” Second, falling interest rates meant that cash-out refinancing became possible while keeping debt service manageable in the face of higher debt levels.
Home-equity borrowing and financial fragility
Using the Panel Survey of Income Dynamics (PSID), we quantify the effects of home-equity-based borrowing. We decompose the debt increase into additional debt incurred by extractors, new homeowners, and upgraders moving to larger homes. Home-equity-based borrowing against existing owner-occupied real estate accounts for around 50% of the increase in housing debt since the 1980s. From the early 1980s to the 2008 crisis, equity extraction alone pushed the household debt-to-income ratio up by more than 30 percentage points. Stratifying home equity extraction by income groups, it turns out that about half of total home-equity-based borrowing is accounted for by middle-class households (50%-90%).
This behavior of households can be rationalized as a Modigliani-style response of middle-class households to capital gains they made in housing markets. The intuition for the positive response is straightforward. When homeowners make capital gains in the housing market, they are richer than they expected when they originally made their financial planning decisions. As housing is indivisible, households need to liquidate some of their home equity if they want to smooth consumption over time. We argue that the observed equity extraction is qualitatively and quantitatively in line with the predictions of recent models such as Berger et al. (2017).
However, this rational response of Modigliani households over time led to a more fragile macro-economy. Home-equity-based borrowing may be rational from an individual household’s point of view, but in the process balance sheets are extended and become more sensitive to shocks. We document this “Minsky” aspect of the debt buildup by conducting a quantitative assessment of household balance sheets akin to stress test for banks. We trace the results of this stress test over seven decades of postwar history and show the increased vulnerability of households to income and house price shocks.
New perspectives on the American debt boom
Taken together, these findings lead us to a more nuanced interpretation of the postwar household debt boom. It is true that middle-class families with low average income growth were chiefly responsible for increased borrowing. It is also true that these households relied on debt to finance consumption in the face of stagnant incomes. But they did so because they had become richer, at least temporarily.
With the housing bust of 2008, the painkiller mechanism for stagnating incomes imploded. What remained was more debt, stagnating incomes and lower wealth. The decade since the global financial crisis has witnessed the largest spike in wealth inequality in American history. The Covid pandemic thus hit American society at a time when the consequences of the last crisis were still tangible.
Note that this history of household debt in America meshes nicely with the idea of a savings glut — arising either from global factors or from growing income concentration at the top as in Mian et al. (2020) – that depressed interest rates. The argument we make is that once the house price increase was under way, home-owning middle-class households made large wealth gains and turned those wealth gains into spending via home-equity-based borrowing. The cumulative effects of this response to higher housing wealth were quantitatively important and turned the American middle class into the epicenter of financial fragility.
References
Berger, David, Veronica Guerrieri, Guido Lorenzoni, and Joseph Vavra (2017). “House Prices and Consumer Spending”. Review of Economic Studies 85.3, pp. 1502–1542.
Jordà, Òscar, Moritz Schularick, and Alan M. Taylor (2017). “Macrofinancial History and the New Business Cycle Facts”. NBER Macroeconomics Annual 31.1, pp. 213–263.
Kuhn, Moritz, Moritz Schularick, and Ulrike I. Steins, “Income and Wealth Inequality in America”. In: Journal of Political Economy, forthcoming.
Mian, Atif, Ludwig Straub, and Amir Sufi (2020). The Saving Glut of the Rich and the Rise in Household Debt. Working Paper.
Piketty, Thomas and Emmanuel Saez (2003). “Income Inequality in the United States, 1913-1998”. Quarterly Journal of Economics 118.1, pp. 1–39.
Rajan, Raghuram G. (2011). Fault Lines: How Hidden Fractures Still Threaten the World Economy. Princeton University Press.