Incomes Destroyed at the Bottom, Profits Supported at the Top
Support from INET and help from Özlem Ömer are gratefully acknowledged.
This note presents broad brush illustrations from a simple accounting model of the impacts of the coronavirus epidemic on macroeconomic balance, with emphasis on fiscal interventions. The premise is that supporting effective demand is essential for sustaining economic activity. The covid-19 epidemic created mass unemployment by shutting activity down. The resulting income loss undoubtedly reduced household consumption which makes up two-thirds of GDP. The only way to restore consumption is for the government acting as the “borrower of last resort” to raise its deficit and transfer the proceeds to households. A numerical example presented below suggests that an increase of ten percentage points in the ratio of government net borrowing (spending on goods and services plus transfers to households minus tax revenues) to GDP would do the trick.
The stimulus legislation now before Congress does not go far enough. Its size — $2.2 trillion or ten percent of GDP – is the right order of magnitude but the breakdown of spending is biased away from households and toward business, viz., payments that may flow more or less directly to households – checks in the mail, more unemployment insurance, small business support, state and local government support, and less than $100 billion to food stamps and disaster relief – come to $1.2 trillion or 5.7% of GDP.
Big business support in the form of loans and a range of other payments amounts to $800 billion or 3.8% of GDP. No doubt, politics aside, some of this money will be usefully spent, but its contribution to aggregate demand will be slow and indirect.
Before getting into the details of demand management, a few background observations are needed.
One is that both government and business have substantial debt overhangs. The simulations suggest that an increase of about $3 trillion in the deficit of the government sector (close to the total built into the various packages now in place or being enacted) is needed to offset the macro shock that the epidemic creates. Outstanding Federal debt is $22 trillion. New issues of three trillion may be difficult for markets to absorb.
Even worse, the corporate sector’s outstanding debt is $10 trillion, five times total profits before depreciation, interest, and taxes. Share buybacks, largely financed by borrowing and ranging in the upper hundreds of billions per year, have been an important driver of growth of debt. The production side of once dominant firms – think of General Electric and Boeing – has been hollowed out by financial engineering. Politics will continue to be influenced by pressures to solve financial problems for firms created by their past mistakes.
On the real side of the economy, over the last two or three decades the share of employment in sectors with low real wages, productivity, and profits increased by around twenty percent. The share of profits in national income grew at around 0.4% per year for five decades, mostly flowing through various channels to households in the top one percent of the size distribution of income. Households at the bottom of the distribution became especially vulnerable.
The major impact on economic activity will come from falling consumption of goods and services due to income losses caused by businesses shutting down. Starting from an initial income level, household saving or the difference between income and spending will shoot up with further multiplier effects on output. High profit activities such as real estate rental and leasing, finance, and information will be protected. Sectors with high employment and low wages and productivity such as retail, accommodation and food, and other services will be hard hit (education and health will be the main exception). To offset the impacts, fiscal demand creation by the government will be essential, with the required outlays depending on the size of the consumption drop and other shocks such as lower private investment and exports.
We begin with details about differences across sectors, and go on to the macroeconomic effects of the coronavirus epidemic on incomes and output.
Dual economy
The shifts in the structure of production just mentioned created an American dual economy with prosperity at the top and near subsistence living at the bottom. Table 1 presents details for sixteen sectors, ordered from the higher to lower rows by decreasing estimates of payments per hour to labor (including “supplements” or contributions for pensions and insurance).
Real wages and productivity vary over wide ranges. The same is true of sectoral profits. Real estate takes the lion’s share, followed by manufacturing, finance, business services, and information. Profits are meager from retail on down the rows, while output and especially employment shares are relatively high. The three sectors mentioned above — retail, accommodation and food, and other services – provide around 46 million jobs, more than one-quarter of the 162 million total. Their labor payments amount to $263 billion, about one percent of GDP of $21 trillion. This number can be contrasted with $600 billion of profits in real estate. Incomes of low-wage workers do not matter
greatly in the grand macroeconomic scheme of things, but for them even a ten percent income loss would be devastating.
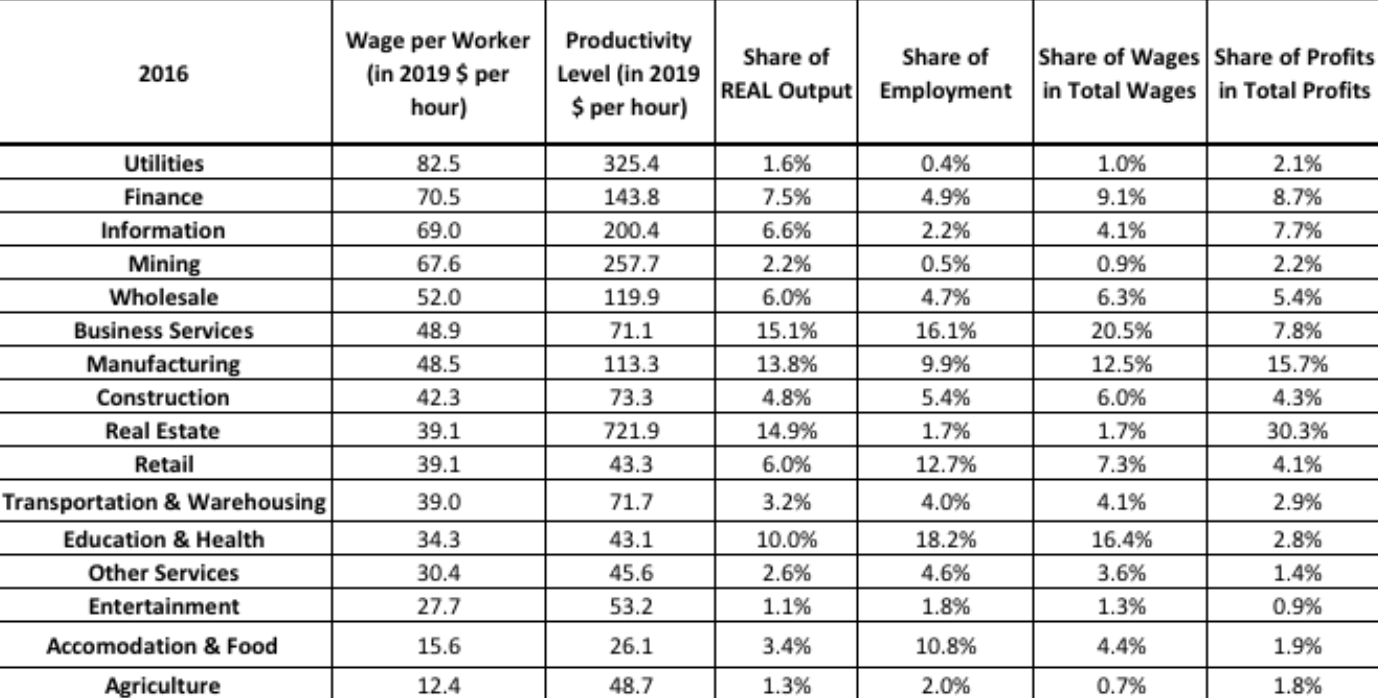
Table 1: Structure of production in 2016 Wages and output used to calculate wage rate per hour and productivity per hour are deflated by the GDP deflator (2019=100). Shares of real output are deflated based on each sector’s own industry price index (2009=100).
Macroeconomic balance
Before turning to the impacts of covid-19, it makes sense to review previous macroeconomic shocks such as the great recession and the smaller Trump tax reduction of 2018. A simple accounting scheme can be built around “net borrowing” (NB) levels of four institutional sectors – households (HH), corporate business, government at all levels, and the rest of the world.
For households and business, NB is equal to gross fixed capital formation plus changes in inventories (“investment”) minus saving. For government, it is current spending on goods and services plus investment minus the excess of tax receipts over fiscal transfers to households. Broadly speaking, foreign NB is the current account surplus or exports minus imports. It is negative for the USA. In the jargon, investment, government spending, and exports are demand “injections.” HH and business saving, taxes minus fiscal transfers, and imports are “leakages.” Overall macroeconomic balance requires that the sum of NB levels across sectors should equal zero (subject to a “statistical discrepancy” between estimates of spending and incomes in the national accounts). Table 2 summarizes data for selected years. The “rates” are calculated with respect to the relevant year’s real GDP.
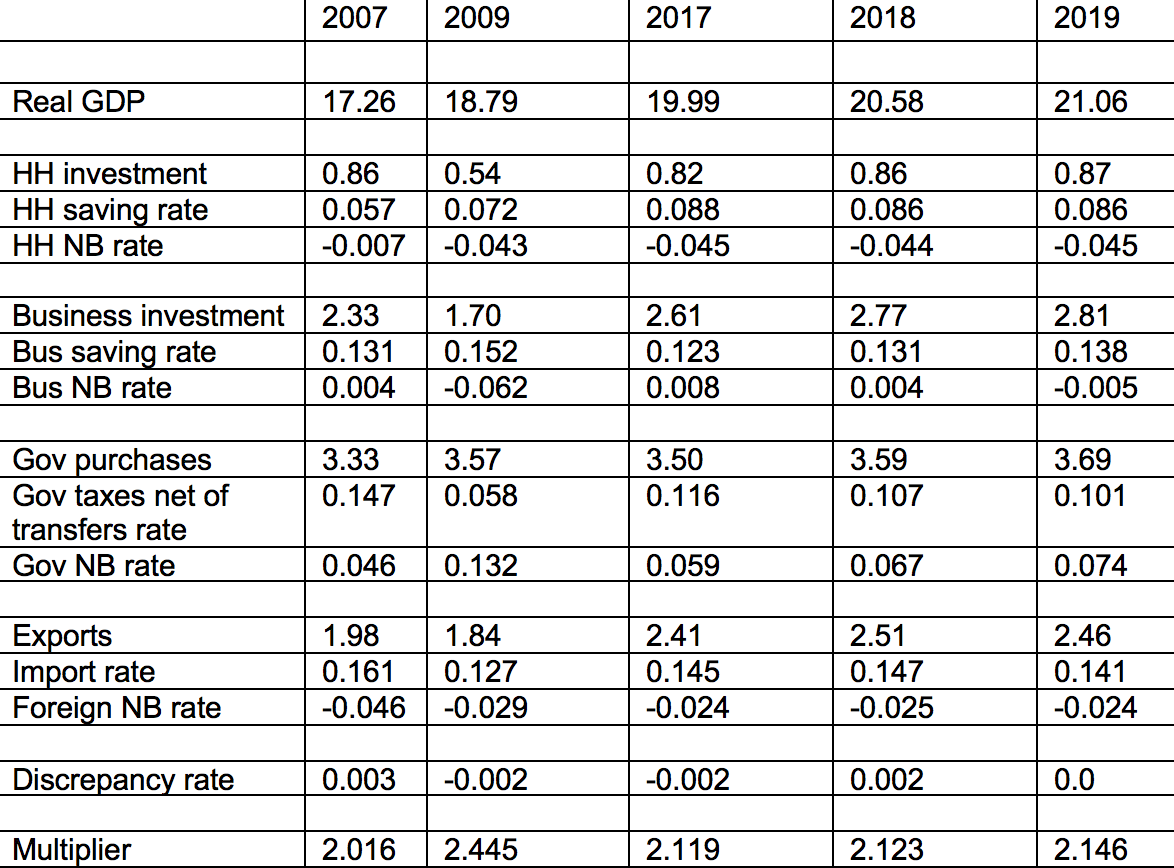
Table 2: Net borrowing behavior in the USA for selected years (levels in trillions of dollars at prices of 2019, rates are relative to GDP)
Each year’s “multiplier” is the inverse of the sum of the four leakage rates. The multiplier times the sum of injections equals output.
In a further illustration, Figure 1 shows annual net borrowing rates in the form of a bar chart. High net borrowing by the government in response to the financial crisis stands out. Even more striking at the far right of the diagram is the fiscal response to the consumption loss due to the coronavirus as estimated in Table 3 below.
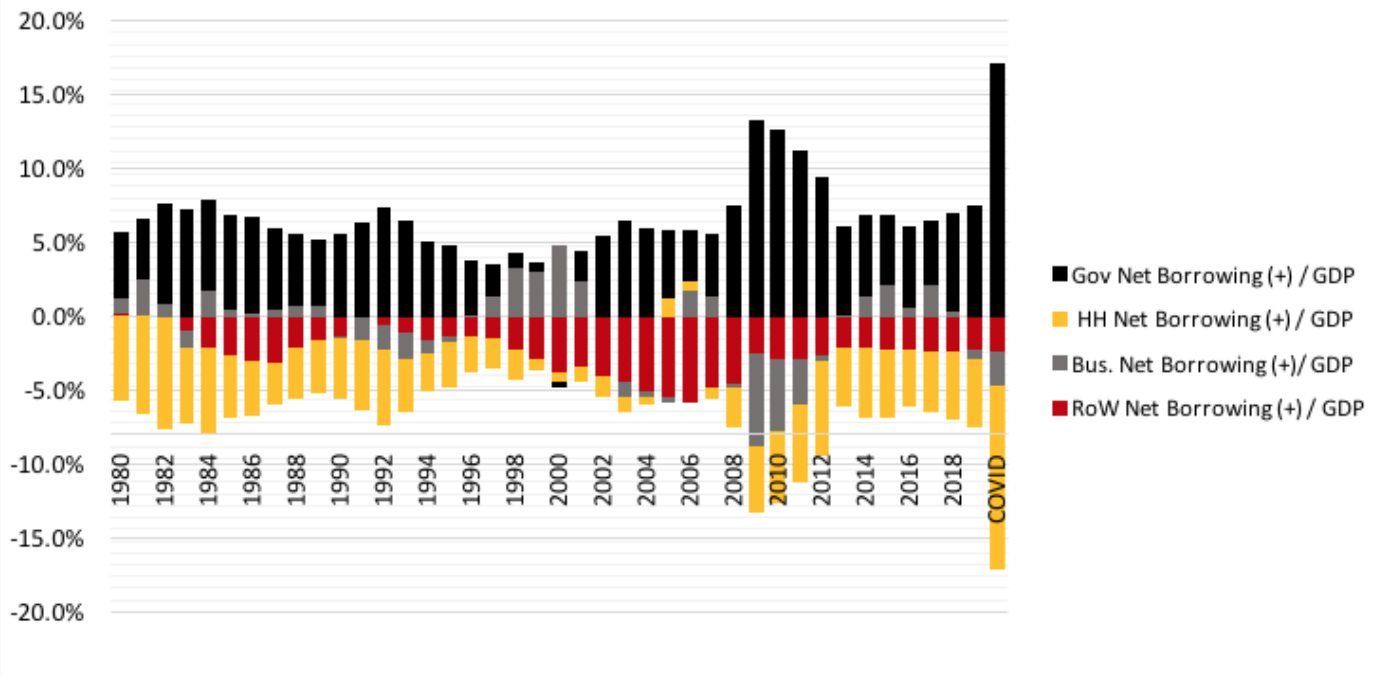
Figure 1: Annual sectoral net borrowing (in the past and estimated for 2020)
The diagram and table show that business retained earnings usually provide the main source of saving, with resources also coming from households and negative net borrowing by the rest of the world (positive net lending to the US economy). The government is the principal net borrower, as underlined by its role in recent macroeconomic events and especially now.
Recession and the Trump tax cut
The 2007-09 recession was precipitated by private sector retrenchment in wake of the financial crisis. Household consumption was flat, while private investment fell by 30%. Household saving and business retained earnings went up, meaning that the overall private saving rate rose from 19% to 22%. Output rose between 2007 and 2009. It would have dropped dramatically if the net government tax-minus-transfer rate had been stable. But in fact it fell from 15% to 6% due to automatic stabilizers and the Obama stimulus package of around 5% of GDP. The overall impact was that private net borrowing fell by 10.2% of output while government borrowing went up by 8.6%. Reduction of the external deficit by 1.7% made up the difference.
In sum, the recession was not a disaster because of fiscal realignment. Causality ran from a private sector shock to automatic and discretionary government responses. It went the other way for the more modest Trump tax cut. The tax-minus-transfer rate fell from 11.6% to 10.7%, or about $185 billion. Output did go up by 2.9%, but the increase would have been greater if there had been a strong business investment boom instead of only a $320 billion increase. Lower business taxes were in large part distributed via dividends and share buybacks to households at the top of the income ladder with high saving rates.
Both episodes show that changing government net borrowing plays a key role in macroeconomic adjustment. More government spending on goods and services (unimportant in 2007-09) will also have to help absorb the covid-19 shock
Coronavirus and consumption
The biggest immediate impact of the epidemic is loss of economic activity as businesses shut down in a “supply” shock. Unless they reopen rapidly, both payments to labor and profits will fall. Household consumption makes up almost 70% of GDP and will drop accordingly.
As an illustration, we can consider a consumption decrease over 2020 of $1.5 trillion from a 2019 level of $14.6 trillion, or 10% (a high but not unreasonable estimate). That amounts to seven percent of GDP. Because they have low or negative saving rates, households hit by loss of low-wage jobs at the bottom of the Table 1 ladder would be major contributors.
For households, saving basically equals income minus spending for consumption, (mostly) residential investment, and taxes. A decrease in consumption translates into higher saving, or in Table 3 a jump of the HH saving rate from 0.086 to 0.156. More saving means less demand creation so that output falls from 21.06 to 18.34 trillion dollars.
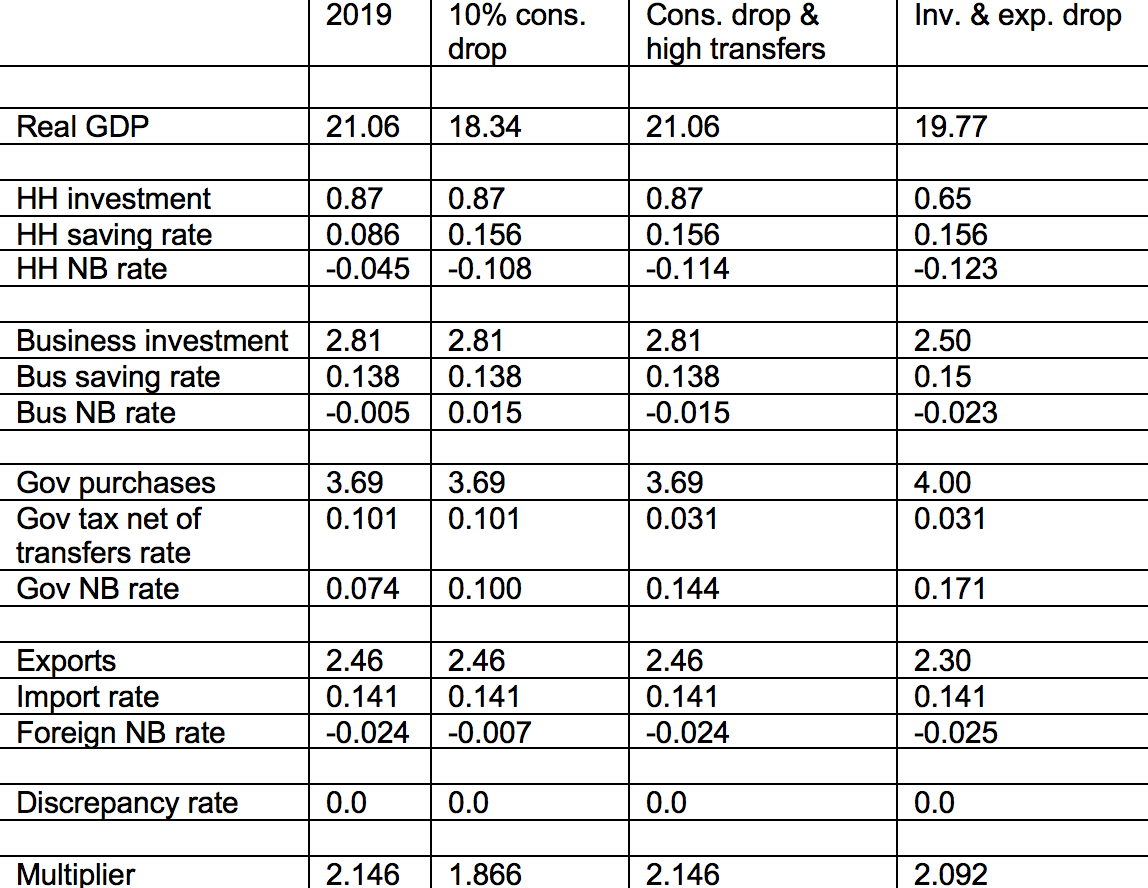
Table 3: Possible effects of the coronavirus shock
In a quirk of national accounting, HH net borrowing falls from -0.045 to -0.108, or net lending to the rest of the economy rises to close to 11% of GDP. Presumably the higher “lending” would take the form of paying off debt. In practice, that will not happen. The proper policy response would be a decrease in the government’s tax-minus-transfer rate from 0.101 to 0.031, taking the form of a $1.5 trillion transfer to households, which could hold consumption spending and output stable over the year. Government borrowing would rise by 7% of GDP, or from $1.56 to $3.03 trillion (compare the two rightmost bars of Figure 1). This hypothetical percentage increase exceeds the actual change between 2007 and 2009 recorded in Table 2.
In other words, the only way to maintain economic activity is for the government to borrow to transfer money to households to support consumption. Ideally, a few hundred billion could be targeted specifically at the poorly paid quarter of the work force in the sectors in the lower part of Table 1, along with poor households who don’t receive labor income.
There are more potential complications. Table 2 shows that private investment fell by around 30% between 2007 and 2009. Lower capital formation along with stable profits drove up retained earnings so that business net borrowing fell. Broadly similar shifts could be expected during the epidemic. Exports could decrease as well. On the other hand, increased government spending on goods and services would raise aggregate demand. In the rightmost column of Table 3, a plausible outcome would be a visible recession, despite government borrowing of 17% of GDP, or $3.4 trillion.
Reality check
The initial impact of covid-19 has been to annihilate labor income through the loss of employment. The challenge is to create demand to offset lost wages and consumer spending. The calculations herein are illustrative at best, although government net borrowing in Table 3 is close to the total outlay of stimulus packages approved by Congress. But there are further complications.
` As noted at the outset, more than three trillion dollars of new government debt is a non-trivial increase over the $22 trillion outstanding. Advocates of Modern Monetary Theory suggest that the Federal Reserve could absorb the new issues, adding to the 15% of government paper that it already holds. In the USA such an experiment is yet to be run.
The Fed has offered to intervene massively to buy up corporate debt, which would also run up its balance sheet. Nevertheless, bailouts for business will remain in political competition with transfers to households in bottom tiers of the income distribution which really need the money. The Obama stimulus directed less than half its outlays toward households. There could be better targeting under present circumstances.
Table 1 suggests that profits in some sectors could be taxed to help offset transfers. Real estate, finance, and information jump to attention.
Timing matters. GDP over one year is the reference frame for Table 3. If, as is likely, job losses and demand decreases are not offset over a shorter period, the effects on economic activity could be devastating.
Finally, immediate direct action is needed to overcome supply shortfalls for
vast amounts of new medical and caretaker services, not to mention production of personal protective gear for caregivers.